
First Solar Case study
Where to begin
To start anything, you want to have some sort of clue what you’re getting yourself into. Even if that clue turns over on its head as you get on.
“Solar stocks” is one of the worst offenders in public markets. It encompasses at least four distinct economic engines with different cost structures, demand drivers, and margin ceilings. I’ll lay it out:
Upstream materials which include poly silicon, ingots, wafers, cells, etc. is a commodity business through and through. These are the materials largely dominated by Chinese manufacturers with state-support. There’s practically no brand, no switching cost, no pricing power. Just pure commodity.
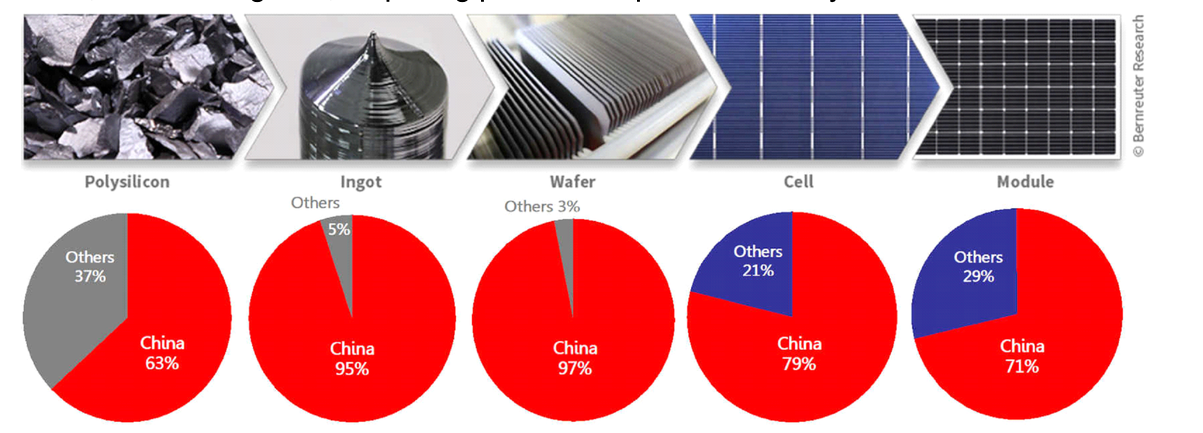
Module assembly splits into 2 very different models:
crystalline-silicon assembly whereby you buy commodity cells, laminate them into a panel, and compete almost entirely on price and freight.
proprietary thin-film technology with a different physical input and a manufacturing process that’s vertically integrated from raw material to finished module inside a single company. This is where First Solar lives. Remember that
Power electronics like inverters, micro inverters, power optimizers, and other highly technical and complicated gadgets that manage how a home or commercial system talks to the grid. This is, again, a very different type of business; it acts more like a specialty electronics or even a software-adjacent hardware business. Demand is driven less by global module pricing and more so by residential financing rates and electricity prices.
Development, financing, and ownership is where the fun happens. It’s where companies actually site, permit, finance, build, and sometimes own solar farms or rooftop systems. Its economics turn on interest rates, interconnection queues (the official wait-list and evaluation process used by grid operators), and long-term power purchase agreements.
So now that we’ve cleared the smoke, it’s easier to approach the solar industry as a fragmented conglomerate, if you will, rather than an umbrella term.
Now I’d love to continue exploring the solar industry as a whole, but that will come up later in forecasts and considerations for this specific company, First Solar, which I will now redirect my attention to.
The structural story in the U.S.
Here’s the thing: the global solar module industry is in genuine structural decline in every definition of that phrase (i.e. persistent overcapacity, falling average selling prices, shrinking margins, etc.) but the specific slice of that industry that First Solar competes in has been growing. Yes, both can be true at the same time. And in this particular case, the entire investment debate on the stock is about how long that gap can persist.
The decline is real and mostly a China story. A decade of aggressive capacity build-out (most of it backed by state-directed financing) left the world with more module manufacturing capacity than demand to absorb said capacity at a price that lets most producers earn a decent return. Another thing to mention: the average commodity manufacturer’s margin profile is thin, volatile, and highly exposed to whatever trade policy happens to be in effect that quarter.
What’s not in structural decline is the market FSLR is built around: U.S. utility-scale solar developers who need non-chinese, cosmetic content modules to qualify for federal tax credits. That demand pocket has been getting policy protected rather than policy exposed. Yes, even as the broader U.S. clean energy subsidy regime has been cut sharply in residential solar. Let’s unpack how this protection works…because the mechanism matters more than the headline.
Before I move on, there’s live evidence that the demand side of even this protected pocket isn’t frictionless; FSLR recorded 8.3 gigawatts of contract cancellations (de-bookings) in 2025. This mainly came from contract terminations by oil&gas and European utility customers re-allocating capital away from U.S. renewables. Its contracted backlog fell from 66.3 gigawatts in 2025 to 47.9 a year later. A backlog is only as strong as the customers’ continued willingness to take delivery, and that willingness has clearly moved against the company even within a segment that’s supposedly the protected one.
Policy as a Moat: Tariffs, 45X, and the FEOC Rules
It’s easy to wave around “tariffs help domestic manufacturers” without actually understanding how the dollars move. So why may FLSR specifically benefit from these policies?
Its technology is a genuine structural differentiator, not just a marketing claim
The company manufactures exclusively in the U.S. at a moment where our industrial and trade policy has been rewritten twice in 3 years specifically around where solar equipment is made.
So in an otherwise commoditizing global industry (basically a race to the bottom; companies compete on price because the product they sell is being commoditized), FSLR is a clean lens for how policy can manufacture a moat.
The company sits in the middle of an unusually visible swing: a lot of real movement with their margins and market cap for a business that, on paper, sells a physical product into a multi-year contracted backlog.
Tariffs are a fading lever. The expiration of the Section 201 tariffs on imported solar cells/modules has modestly cheapened that tier of the market. So tariffs are useful for FSLR while they’re in effect, but not the durable part of the story.
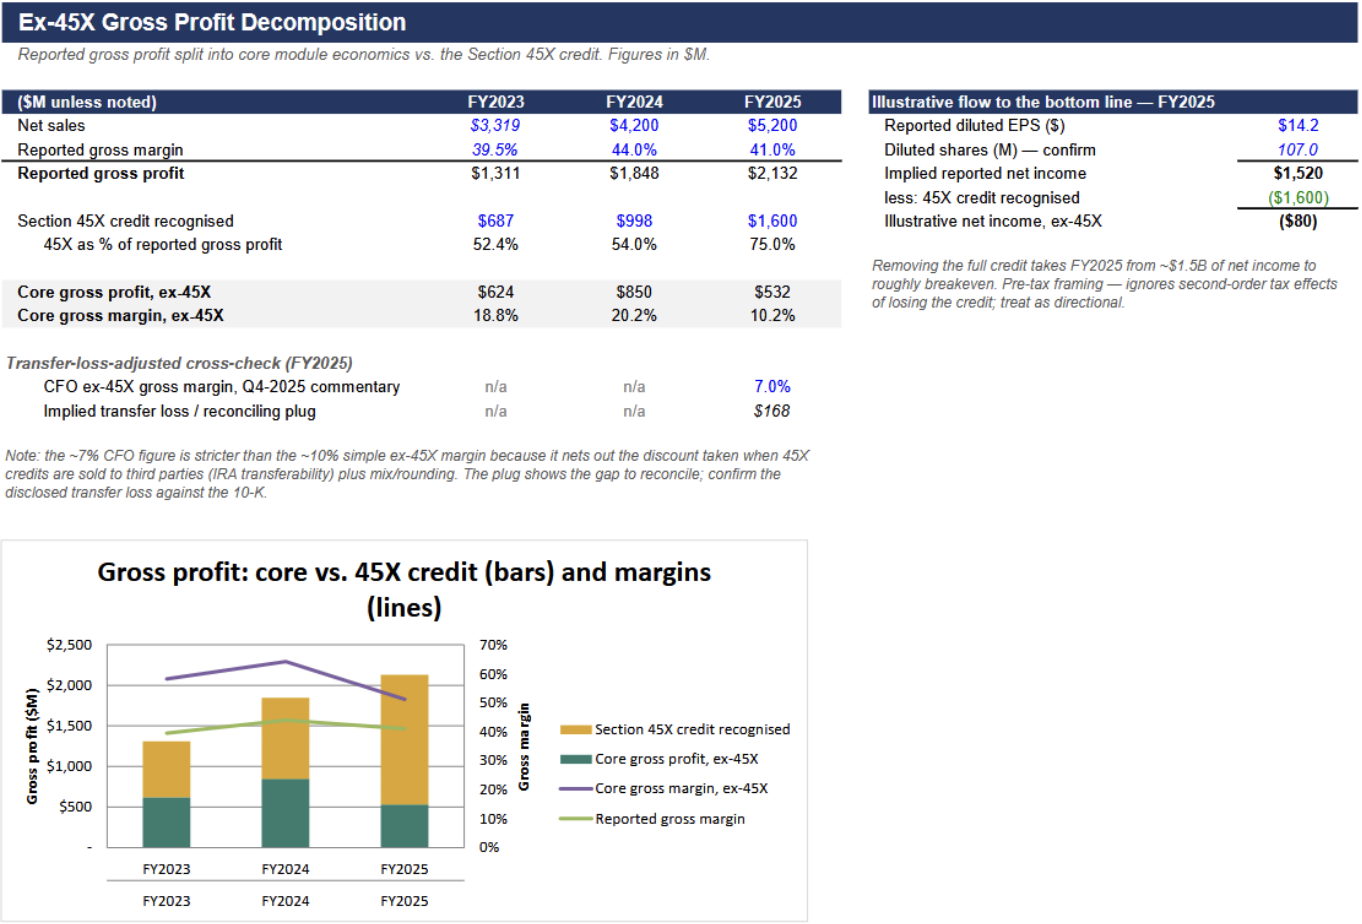
Additionally, we have the Section 45X direct subsidy. This is the interesting part of FSLR’s case that drew me to it. The IRA’s Section 45X Advanced Manufacturing Production Credit pays a domestic manufacturer a credit per watt for solar equipment actually produced in the U.S. This is a direct cash credit that lowers FSLR’s own effective cost of production. I have the actual excel linked, but here’s a glimpse of the 45X decomposition over the last 3 year that it’s been in effect.
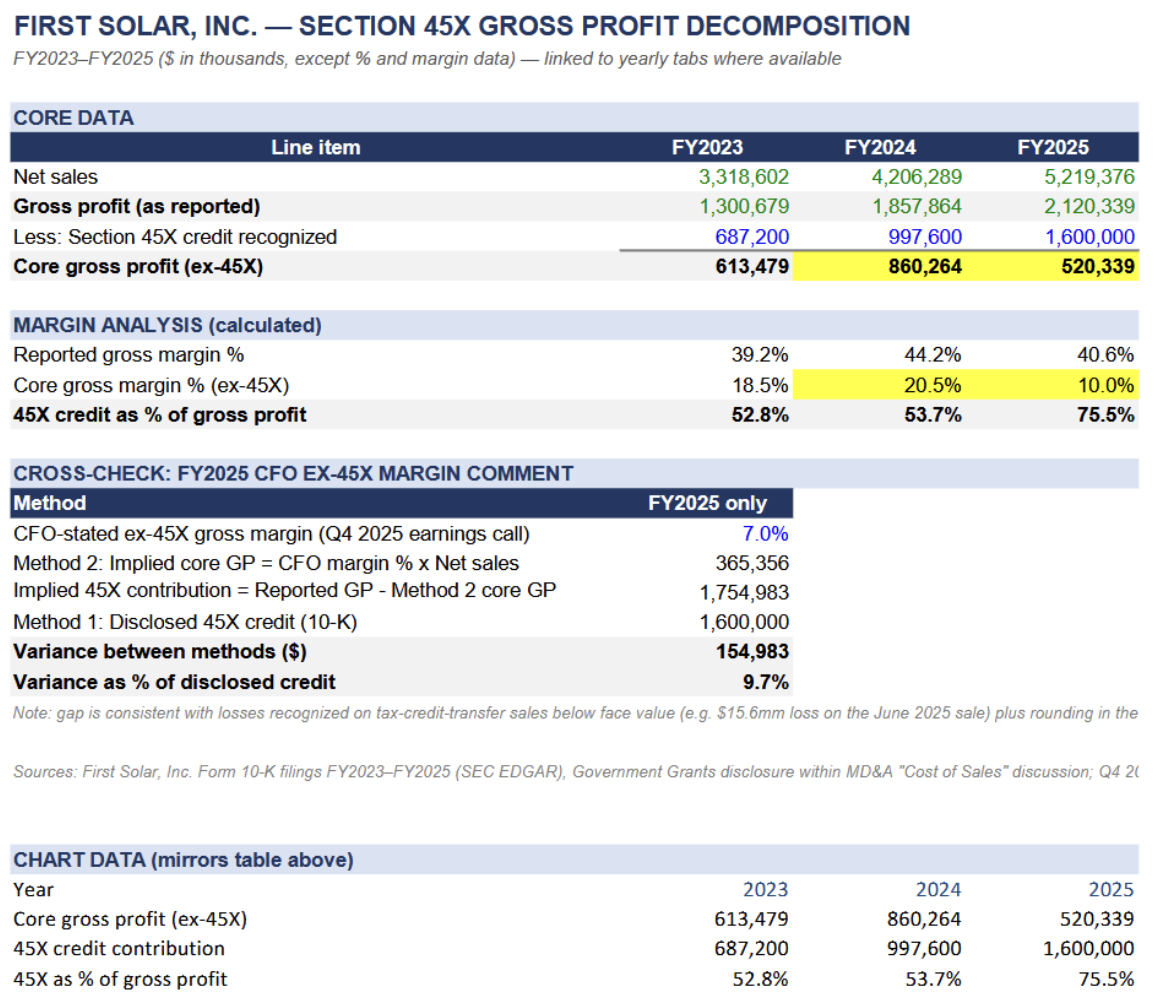
First Solar recognized $1.6b of Section 45X credits in 2025 alone, against roughly $2b of total gross profit implied by its 41% gross margin on $5b of net sales. I’ll analyze what this ratio says briefly.
Last thing to mention is the FEOC rules. The One Big Beautiful Bill Act (OBBBA) cut clean energy subsidies sharply in some places (like eliminating the residential 25D credit and accelerating phase-outs for wind/solar investment and production tax credits at the project level) while, in the same legislation, tightening who’s allowed to claim the manufacturing-side credits that matter the most to FSLR. Essentially, FEOC rules restrict full investment tax credit eligibility for any project that uses “material assistance” from China, Russia, Iran, or North Korea anywhere in its supply chain.
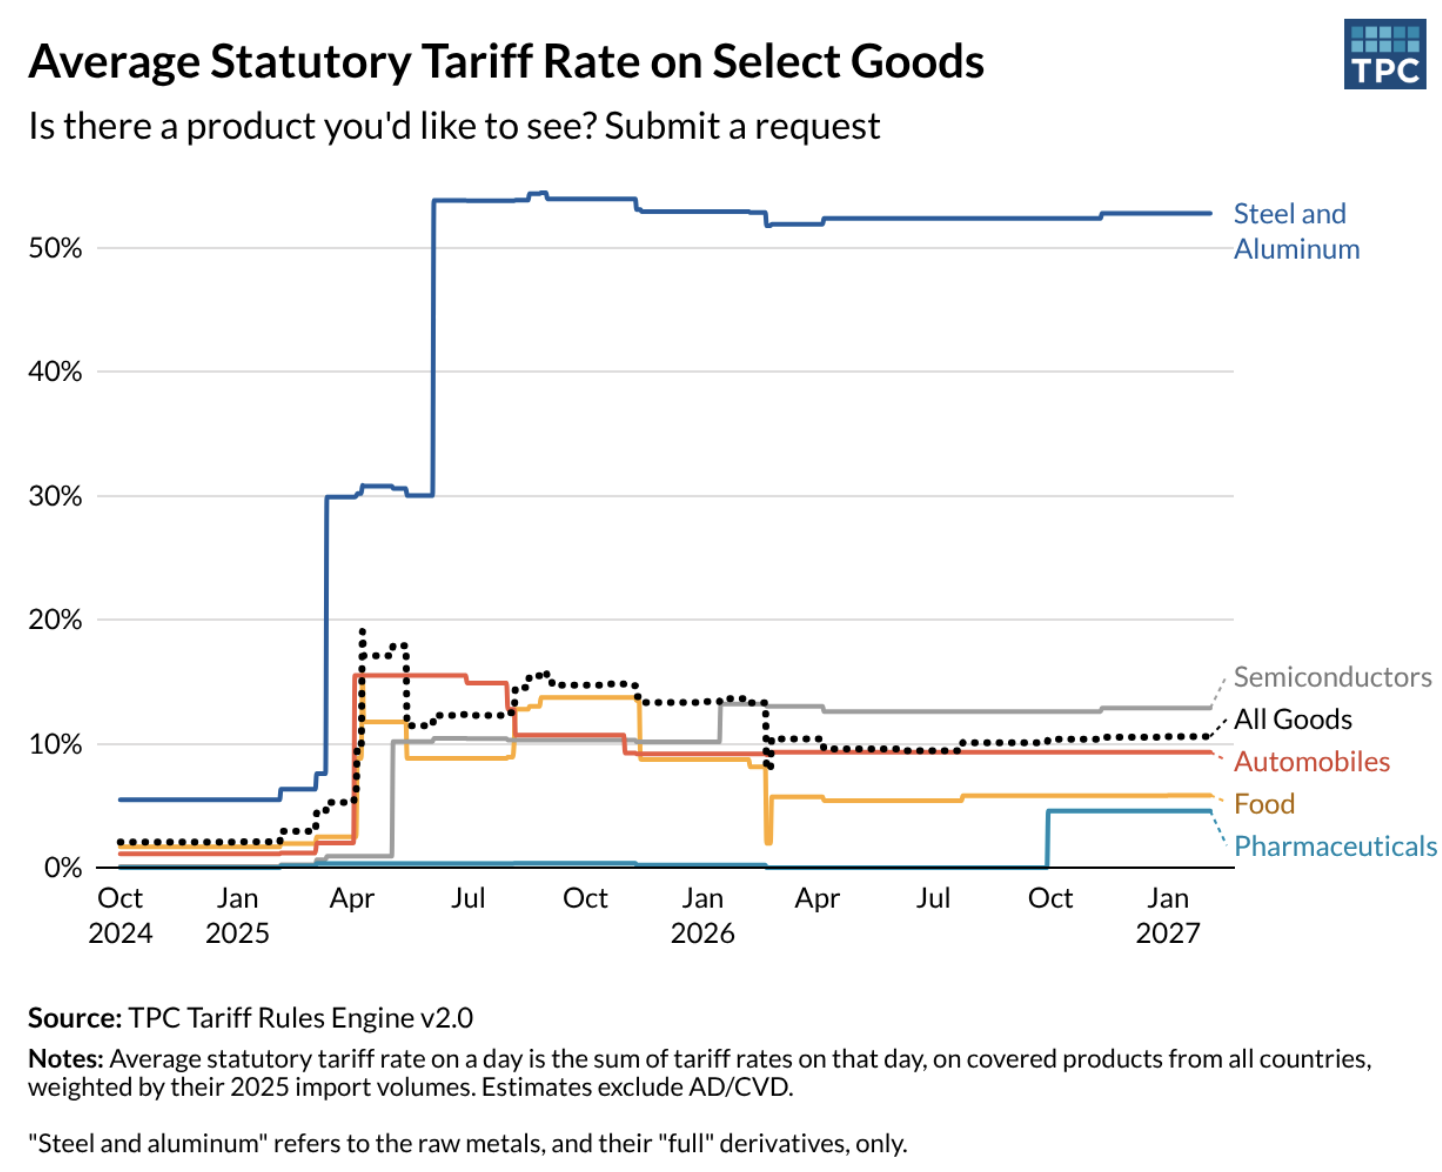
Something I tossed around in my mind was the reliability of this moat. In the sense that foreign policy is a rapidly evolving and complicated subject. For example, Canadian Solar’s vertically integrated, China-linked module and storage reported a Q1 2026 gross margin of 25%, but roughly 12% of that was a single one-time tariff refund.
Put the pieces together and the net effect is straightforward even though the legislative language isn’t: a U.S. utility-scale developer who wants the project-level tax credit increasingly has to buy non-chinese, domestic-content modules, and the credit-eligible manufacturers competing for that demand can no longer include Chinese-linked products. Try saying that 10 times…I bet saying “supercalifragilisticexpialidocious” is easier.
The residential side of the industry lost its subsidy outright; the utility-scale, domestic content side gained a narrower but more defensible one. Same bill, opposite effects on two different layers of the same labeled industry.
Financial Deep Dive
Here’s the revenue, margin, and earnings trajectory going back to 2018.
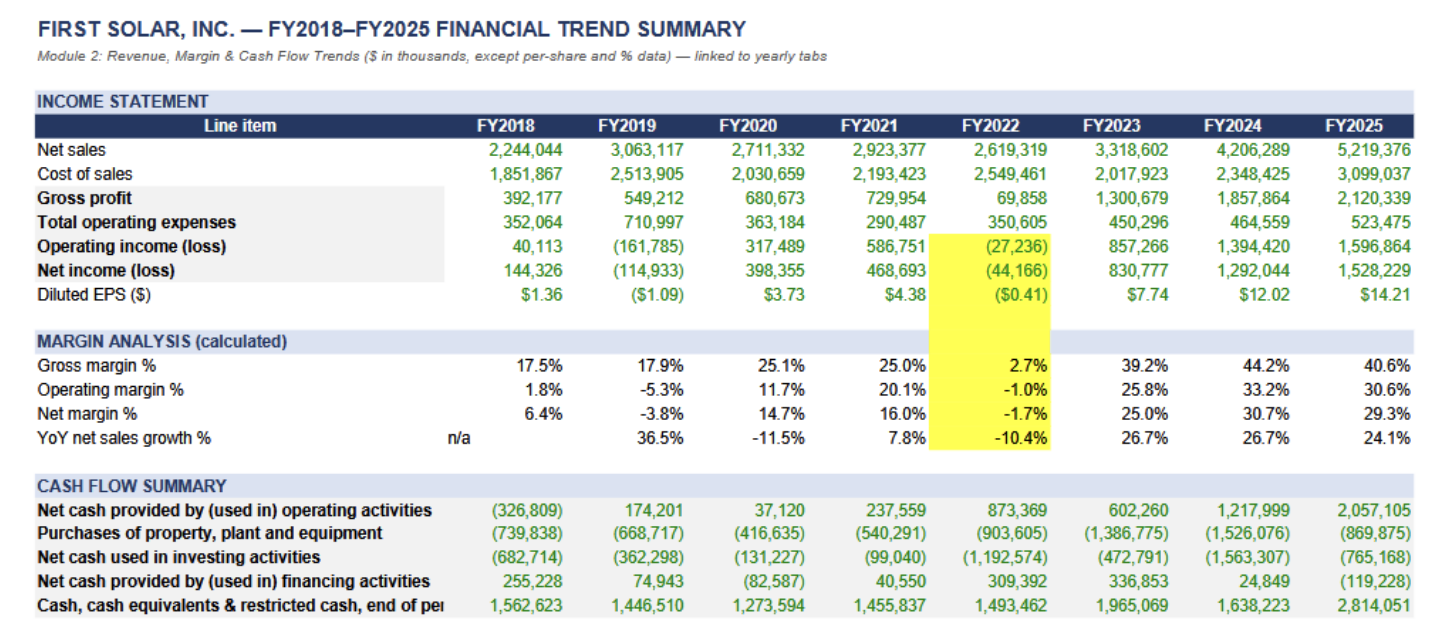
I took notes on this so it’s not very fashionable, but it includes comments that are visible on excel.
Point is: what’s happening to revenue vs. gross margin…because top line growth and margin quality are 2 different things. Two things obviously jump out first:
Full year 2025 revenue grew nicely (+24%) even as gross margin compressed 3 full points. See above!
Note: management attributed the 2025 margin decline to tariff costs, warehousing expense made worse by a revenue mix that was unusually back-half-weighted within the year, freight detention & demurrage charges, a higher proportion o flower-margin sales into the Indian market, and a one time hit from contract terminations by BP-affiliated customers.
The 2026 guidance implies an 8.5-point gross margin recovery despite flat-ish revenue. This only makes sense when you know the mix shift behind it: more of the volume moving to fully domestic, 45X-eligible production; lower international freight as shipments to non-U.S. markets shrink; and a supply disruption at their Alabama facility resolving. However, none of this is operating leverage in the ordinary sense; it’s almost entirely a change in which credits and cost lines apply to which units. That distinction matters enormously for how durable we should assume the higher margin is once we analyze a forward model.
One note on their backlog (which is the financial equivalent of a strong handshake): it shrank by more than a quarter of its volume in a single year, almost entirely from contract terminations rather than fulfilled deliveries outpacing new orders. In other words, demand-side political and strategic risk sitting on top of supply-side policy risk we already discussed.
Balance sheet and capital allocation
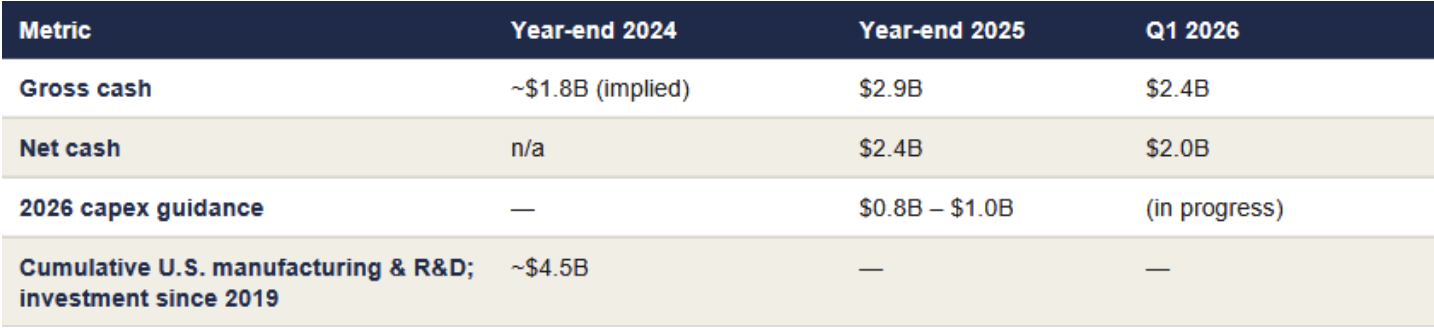
FSLR enters this cycle with very little leverage (total debt-to-equity in the high single digits as a percentage) and a large growing cash cushion that has let it self-fund a multi-year domestic capacity build without diluting shareholders or taking meaningful debt.
That balance sheet debt strength is itself a competitive advantage in a capital-intensive industry; it lets the company keep investing through a margin downturn (2025) without flinching, which a more leveraged or cash constrained competitor couldn’t necessarily do.
One thing I should flag (it’s small relative to the headline numbers): they have provisioned a $50 million warranty liability for pre-2025 Series 7 modules. Yes, it’s immaterial to a company generating well over a billion of operating profit, but it’s a useful reminder that a still-evolving manufacturing technology carries real product-quality tail risk.
The QofE Lens
Let me venture a question: of the profit a company reports, how much reflects durable, repeatable operating economics, and how much reflects something that could disappear with the next election?
Let’s re-run the arithmetic on First Solar directly:
Full-year 2025 net sales were $5.2 billion at a 41% gross margin, which implies roughly $2.1 billion of gross profit. Section 45X credits recognized in the same year were $1.6 billion.
The conjecture: a dollar figure roughly three-quarters the size of total gross profit is coming from a single federal tax credit that did not exist in this form before 2022 and has already been rewritten once (in 2025).
So the question here is how politically contestable is this specific dollar and what is my exposure if it’s contested. So the intuition I’d like to take away from this is before you trust a margin, ask what it would look like with the subsidy, the one-time item, or the favorable mix backed out.
The trading multiples…
First Solar's market cap moved from roughly $20.0 billion in January 2025 down to $13.7 billion in March 2025, back up to $19.7 billion by August, on to a peak of about $28.5 billion in November, and back down to $21.0 billion by April 2026–a swing of more than 100% peak to trough and back, in a single year, for a company selling a physical product against a multi-year contracted backlog. That’s the first thing worth sitting with: revenue visibility does not buy you valuation stability when the thing being priced is policy durability rather than demand.
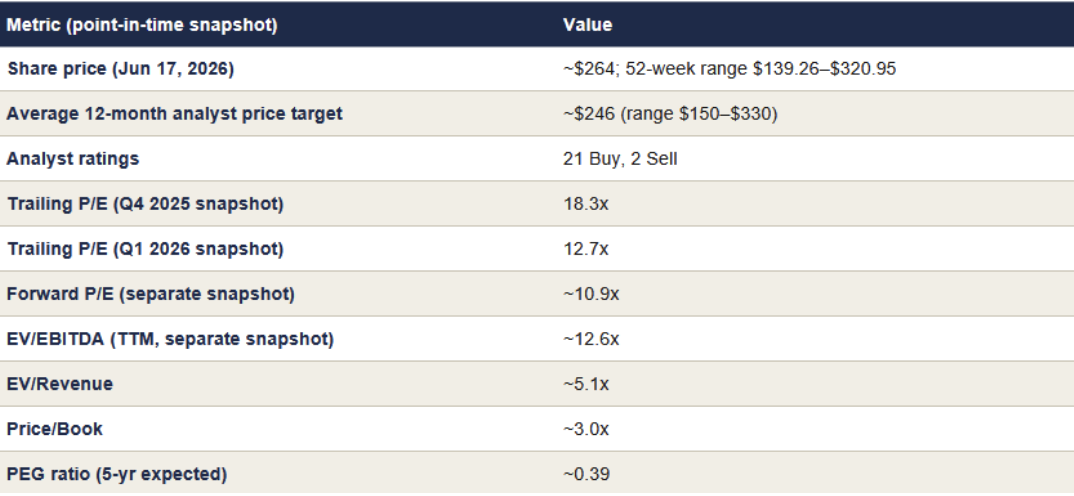
DISCLAIMER: These multiples are pulled from different snapshots across late 2025 and early 2026 and should be read as illustrative of range and direction, not as a single coherent point-in-time valuation table.
A PEG ratio near 0.4 and a forward P/E roughly half the trailing P/E both point toward a market that is pricing in substantial near-term earnings growth (consistent with the 2026 margin-recovery guidance discussed earlier).
The wide gap between the average analyst price target (~$246) and the 52-week high ($320.95) tells me the sell side itself is not unanimous about how much of that guided recovery to trust at face value, which loops directly back to the quasi-QofE question from earlier: the multiple the market is willing to pay depends heavily on how durable investors believe the 45X-driven margin expansion actually is.
Peer comparison
Let’s look at the “module manufacturers” and what they structurally have in common (or rather, don’t). One is a domestic, technology-differentiated, policy-protected producer and the other is a vertically integrated commodity producer exposed to Chinese-linked supply chains and getting paid only one-time, expiring tariff refunds rather than recurring production credits. Same noun ("module manufacturer"), structurally different business.
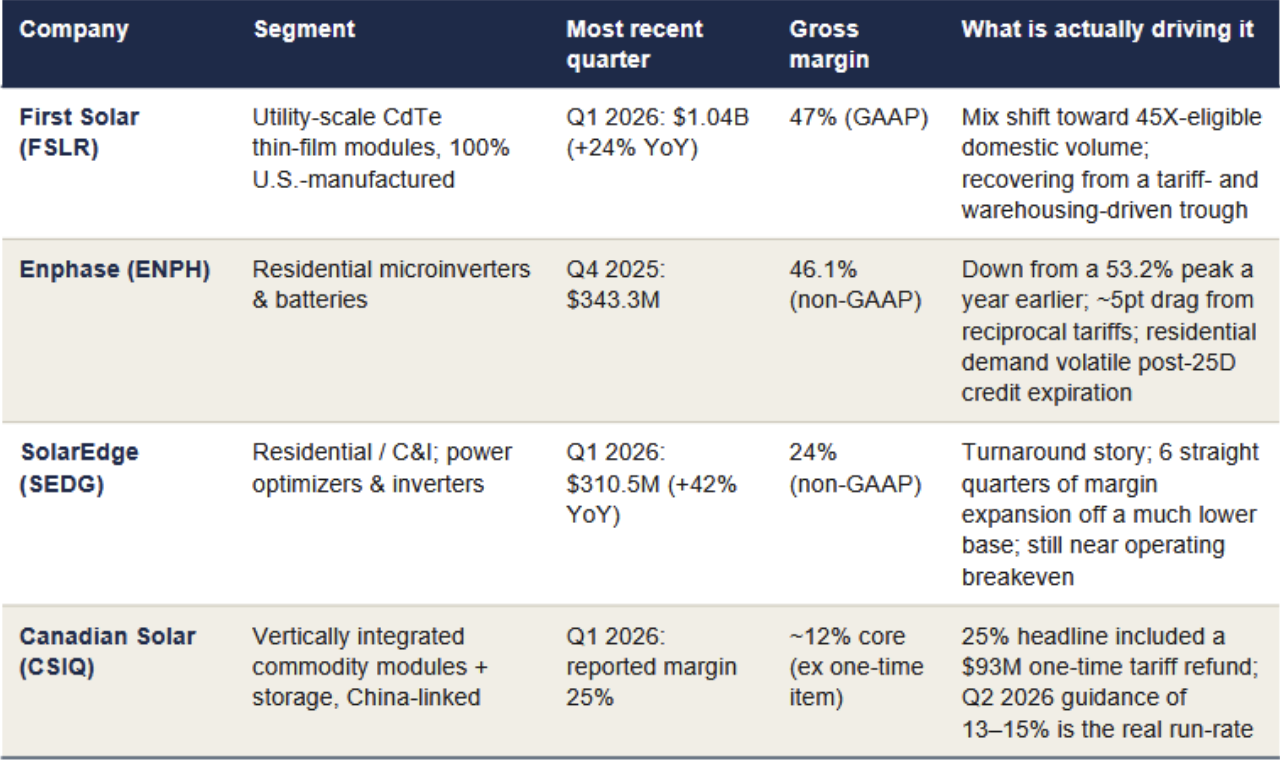
Sources: company Q4 2025/Q1 2026 earnings releases and earnings-call coverage
The Verdict
Bear case:
The bear case starts with backlog durability: 8.3 gigawatts of cancellations in 2025 and a 27%-plus decline in contracted volume year-over-year show that even the protected, domestic-content segment of demand is not immune to customers walking away, particularly oil-and-gas and European utility buyers reallocating capital out of U.S. renewables for reasons that have nothing to do with First Solar's product quality or price. Layer on top of that genuine policy fragility — the 45X credit and FEOC restrictions that constitute the core of the moat were themselves rewritten once in 2025 and could be rewritten again under a future Congress or administration, and roughly three-quarters of 2025 gross profit by scale is tied to that single credit. Add execution risk on a still-ramping multi-plant U.S. buildout (Louisiana just reached commercial production; South Carolina is not yet online), a real product-quality liability on the prior-generation Series 7 module, roughly 20%-utilized Southeast Asian assets that are a continuing cost drag with no clear restart timeline, and a India market mix that exposed margins to a separate set of pending trade actions. None of these individually breaks the thesis, but they compound.
Bull case:
The bull case is that the FEOC and domestic-content rules structurally lock Chinese-linked manufacturers out of the most attractive part of U.S. demand for the foreseeable legislative horizon, and First Solar is essentially the only company at scale positioned to capture it with a technologically differentiated product rather than a commodity one. A net cash balance sheet with very low leverage lets the company keep self-funding expansion through margin downturns without diluting shareholders, which is a real advantage over capital-constrained peers. The CuRe technology platform is a credible second-generation product improvement, not just a policy shield, addressing exactly the degradation issue that produced the Series 7 warranty liability. And even after losing more than a quarter of its volume to cancellations, the remaining backlog is large enough (tens of billions of dollars in contracted value) to provide multi-year revenue visibility that few manufacturers in any industry currently have.